...
Graphing consists of two parts - the first part collects information and the other part displays data on a Web page. To access the graphics, type https://[Router_IP_address]/graphs/ and choose a graphic to display in your Web browser.
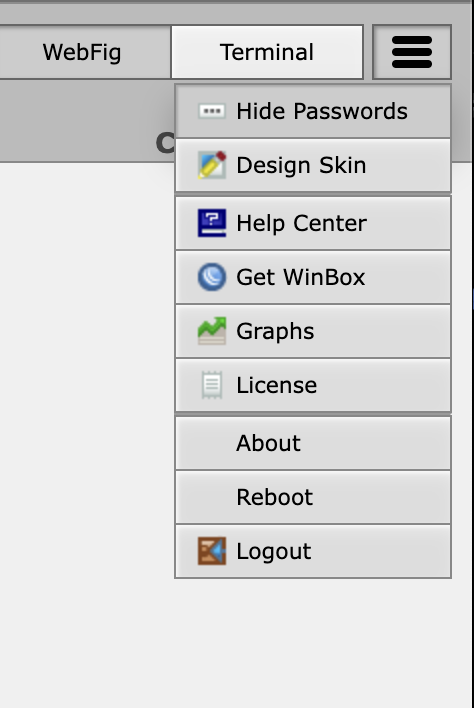
Alternatively, look for the menu ≡ (triple bar sign) in the top right corner of the WebFig interface, allowing you to find "graphing monitor":
Example of memory graphs:
...