...
The example above shows us, that the KNOT sees two Bluetooth tags within its operating range with MAC addresses "DC:2C:6E:0F:C0:3D" and "2C:C8:1B:4B:BB:0A", their respective payloads ("DATA" field) and the signal strength ("RSSI" field).
| Info |
|---|
| When testing locally to see how many payloads can the KNOT handle, we've achieved the following results → with 300 tags (in factory settings), scattered around the KNOT and using a Bluetooth filter "keep-newest" (which overwrites previously received payloads for each unique MAC address with the newest one, so that the Bluetooth list would display 1 payload per 1 unique tag's MAC address at all times), all 300 MAC addresses appeared in the KNOT's range after 30-40 seconds. This is where you need to keep in mind that all 300 tags broadcasting over the same channels at the same time will cause interference (delay in the reception). When we "cleared" the Bluetooth payload list, each second the list got 20 new entries and after about ~15 seconds, the list had 250-290 payloads. Then after ~15 seconds more, the list displayed all 300 unique tag payloads. The actual number of tags your KNOT is able to handle is heavily dependent on the environment, so it is better to test it on sight. |
With the help of RouterOS scripting and scheduling, we can make the KNOT automatically-periodically scan the payload list and, in case, a specific payload or a specific tag's MAC address is found on the list, we can make the KNOT structure an MQTT message (out of the printed information shown in the example above) and send it to the configured server via MQTT, e-mail or HTTP post. Script examples will be shown later on in the guide.
...
In the second example, we will showcase another topology:
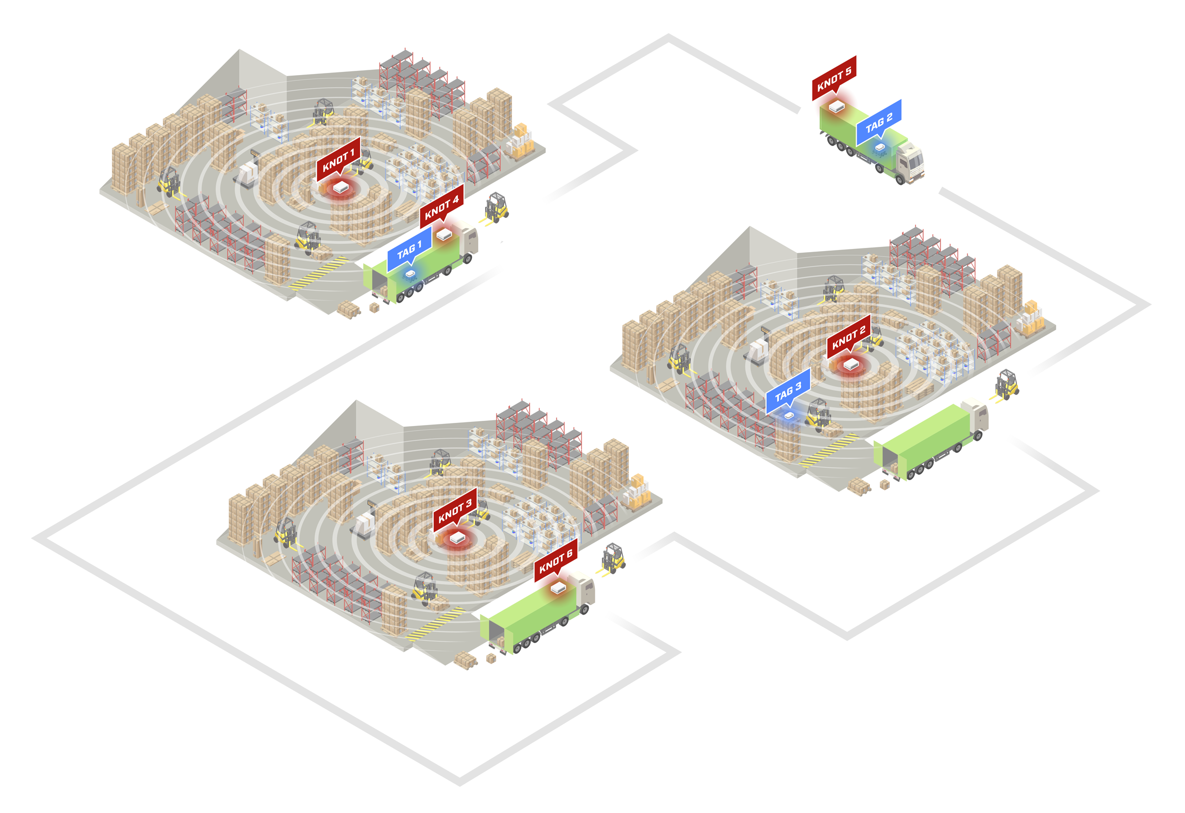
We have a few warehouses, a few company delivery vehicles, and 3 assets that we are interested in tracking. Our assets are pallets that hold cargo and our goals are to know:
- in which specific warehouse (equipped with the KNOT) the asset (equipped with the tag) is currently in and how much time it spent inside the specific warehouse;
- whether the asset (equipped with the tag) is on the road, traveling between warehouses, and how much time it spent inside the vehicle (equipped with the KNOT);
- (optionally) if TG-BT5-OUT tags are used, what was the temperature during all this time? You can also/instead monitor other parameters that you can get out of the advertised payload, like for example acceleration;
- (optionally) find out where exactly is the KNOT traveling using 's GPS coordinateslocation.
To achieve Bluetooth asset-tracking, just install x1 KNOT per warehouse, x1 KNOT per vehicle, and x1 tag per asset.
...
| Code Block | ||
|---|---|---|
| ||
/system script run tracking |
Script that includes temperature data (optional)
In case you wish to add temperature reports to the structured message, use the script below:
...
| Info |
|---|
Because of the fact that floating point is not supported → every calculation behind a decimal point will be "rounded up" to a whole number. This is why the script will calculate the temperature and acceleration values scaled by 1000 (multiplied by 1000). |
Script that includes GPS data (optional)
In case you also wish to include GPS data (longitude and latitude values from the KNOTs), use the script shown below:
...
| Code Block | ||
|---|---|---|
| ||
/system/scheduler/add name=bluetoothscheduler interval=30s50s on-event="/system/script/run tracking" |
...
- from ~11:00 to ~11:30, our asset was inside KNOT_1 Bluetooth range (inside warehouse #1);
- from ~11:30 to ~11:35, our asset was relocated to the vehicle (KNOT_2) that was parked near the warehouse (the tag was inside both KNOT's ranges);
- from ~11:35 to ~12:00, the tag was inside the truck (KNOT_2) - traveling to another warehouse;
- from ~12:00 to ~12:05, the asset was parked outside of warehouse #2, and it was inside both KNOT_2 and KNOT_3 ranges at the same time;
- from ~12:05 to 12:30, our asset was stored inside warehouse #2 (KNOT_3);
- from ~12.:30 onwards, the tag was on the road again, inside the truck (KNOT_2).
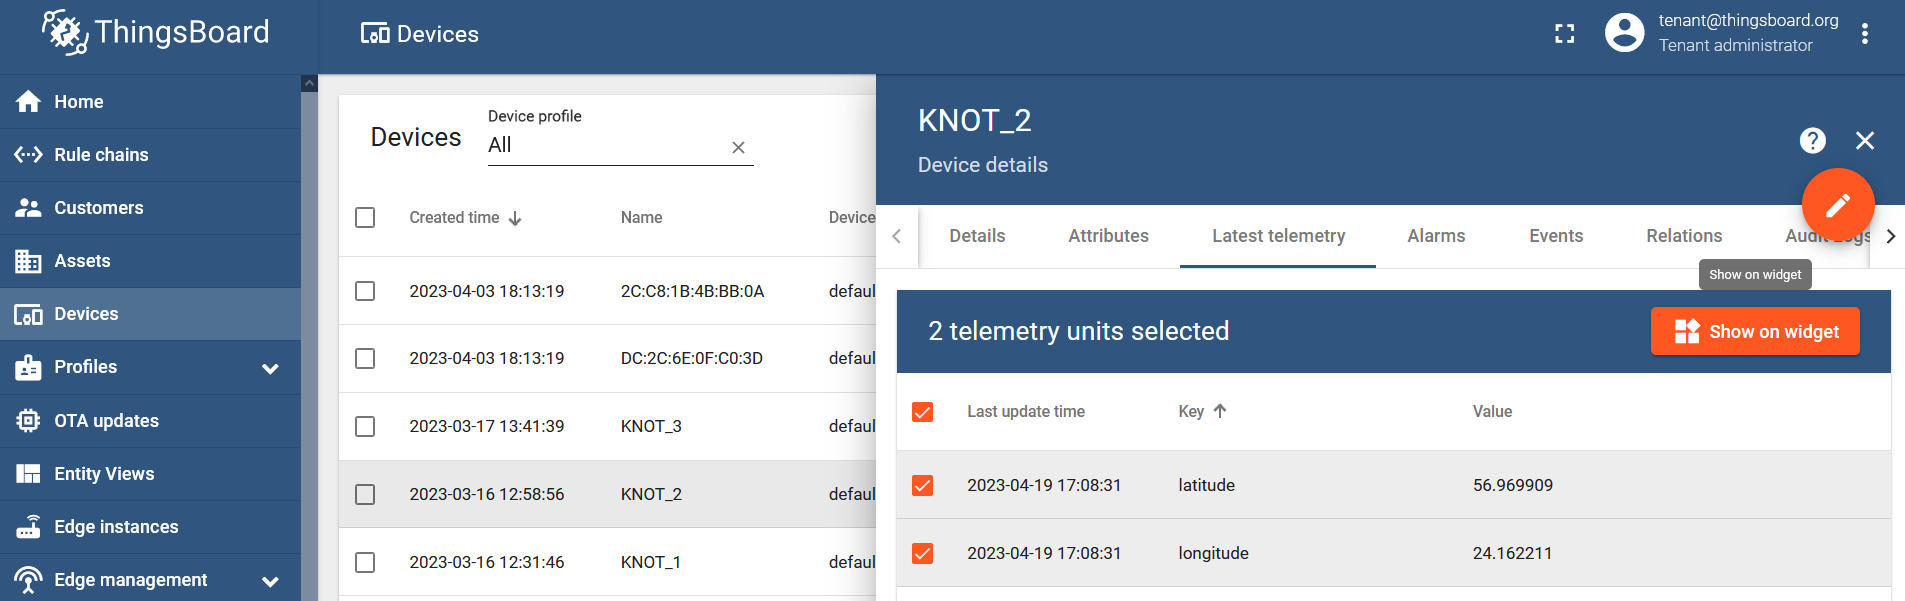
Temperature visualization (optional)
Select the tag's MAC address from the list of devices, go to the "Latest telemetry" section, checkbox "temp" parameter, and click on the "Show on widget" button:
...
Now you have an additional graph that indicates how the tag's temperature changes during different time intervals.
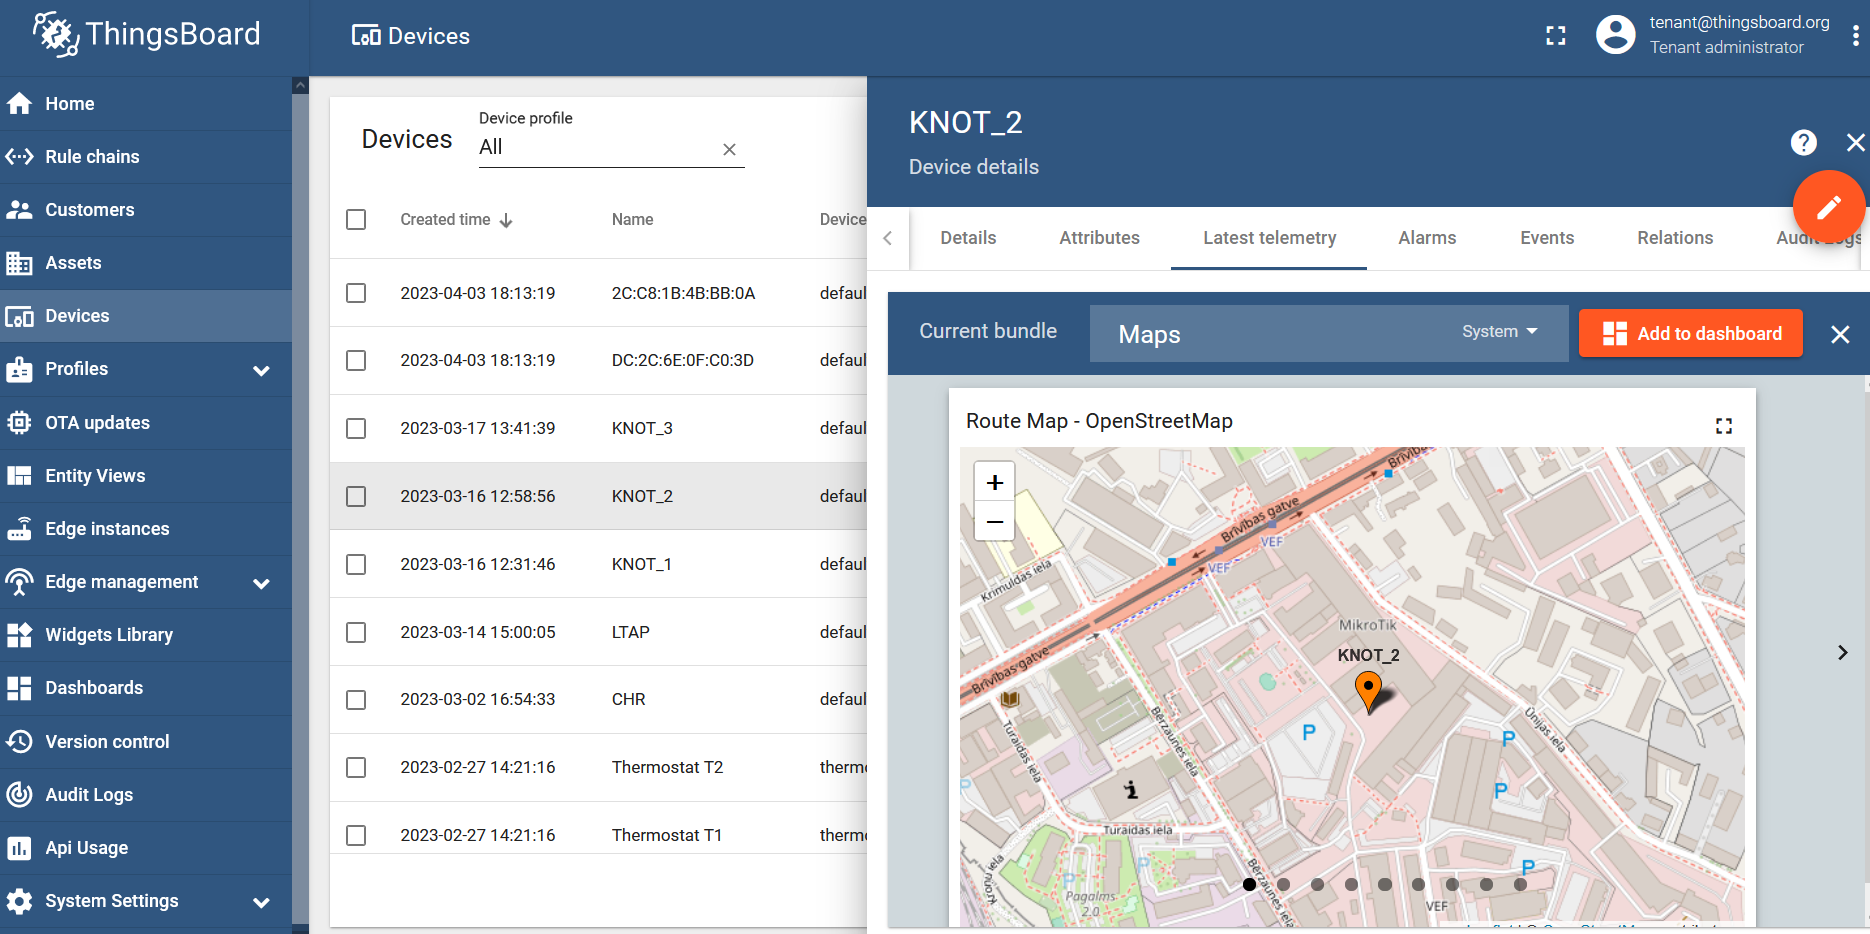
GPS coordinate
...
visualization (optional)
Per the script in the Script that includes GPS data section, the script sends x2 MQTT messages. Each message is sent to a different MQTT topic. GPS coordinate message will be posted to a topic named "1/devices/me/telemetry", while Bluetooth data will be posted to a topic named "v1/gateway/telemetry". Coordinates will be available to you under the ThingsBoard device list, under the specific gateway:
Checkbox both "latitude" and "longitude" parameters, click on the "Show on widget button", select "Current bundle" to "Maps", and choose the "Route Map - OpenStreetMap" widget:
To finish things up, click on the "Add to dashboard" button and choose the dashboard where you want the widget to be shown.
After adding 3 widgets into 1 dashboard (temperature line chart, Bluetooth reporter bar chart, and GPS coordinates map), you would get something similar to this:
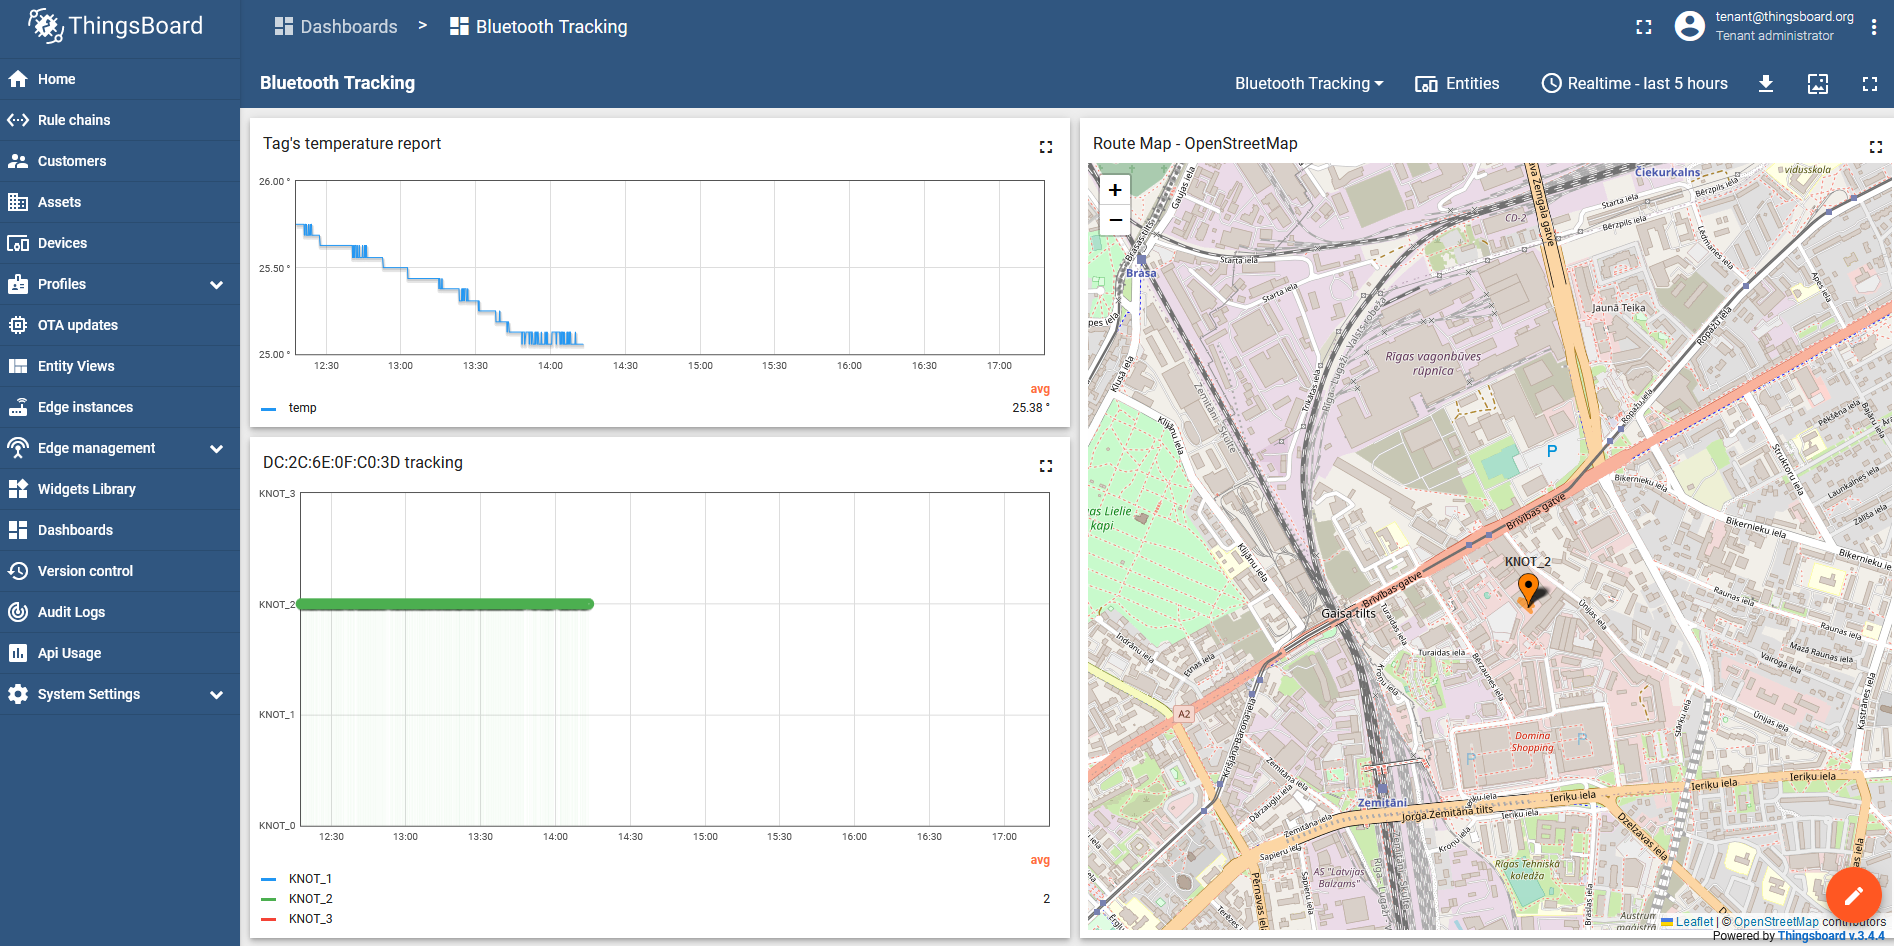
- You will have a graph showing temperature changes (the tag's surrounding temperature);
- You will have the chart that indicates which specific KNOT has sent the report, that tells you in which KNOT's Bluetooth range the tag is currently in;
- You will have a map that shows the GPS position of the KNOT.