changes.mady.by.user Deniss M.
Saved on Apr 04, 2023
...
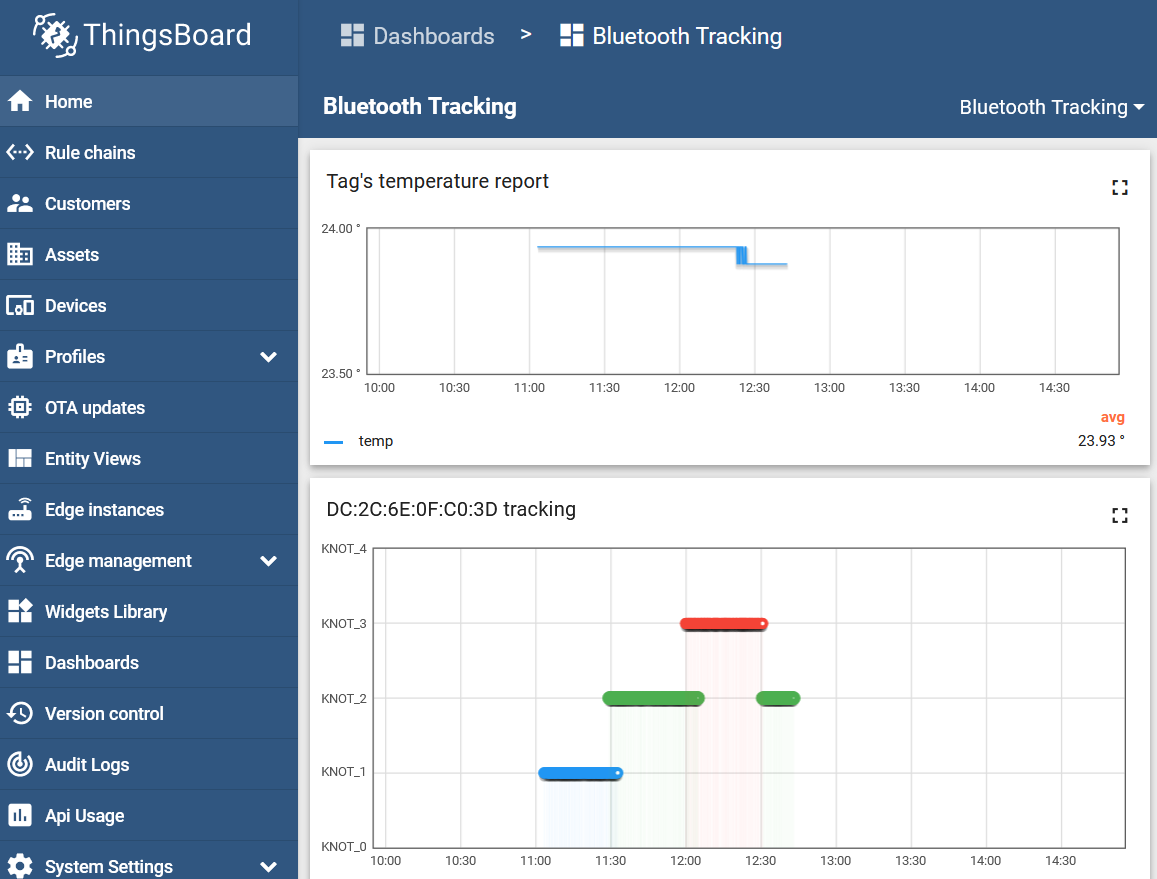
The result would look like this:
Now you will have an additional graph that will indicate indicates how the tag's temperature changed changes during different time intervals.