...
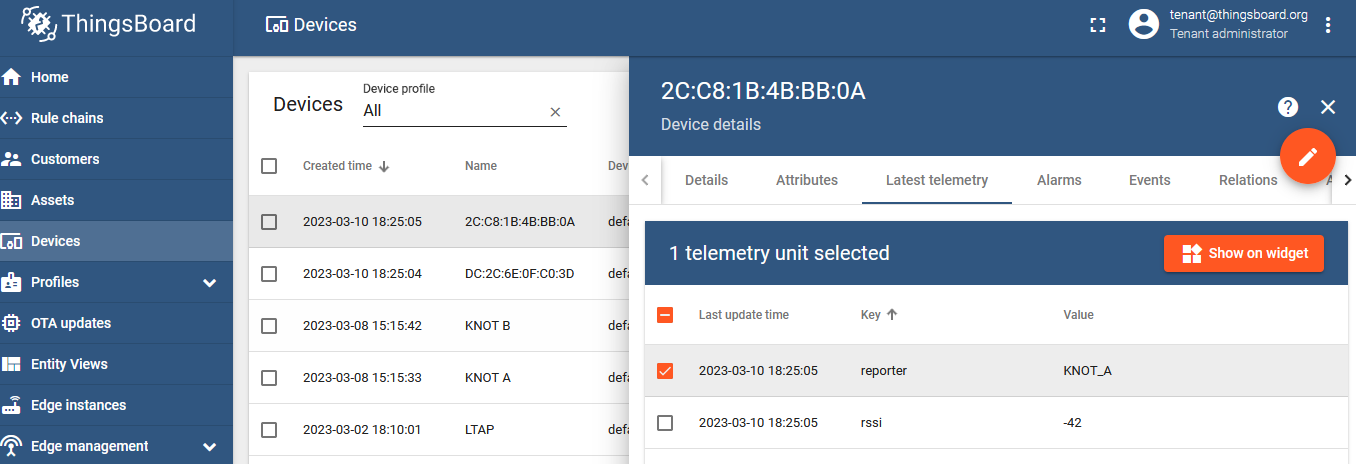
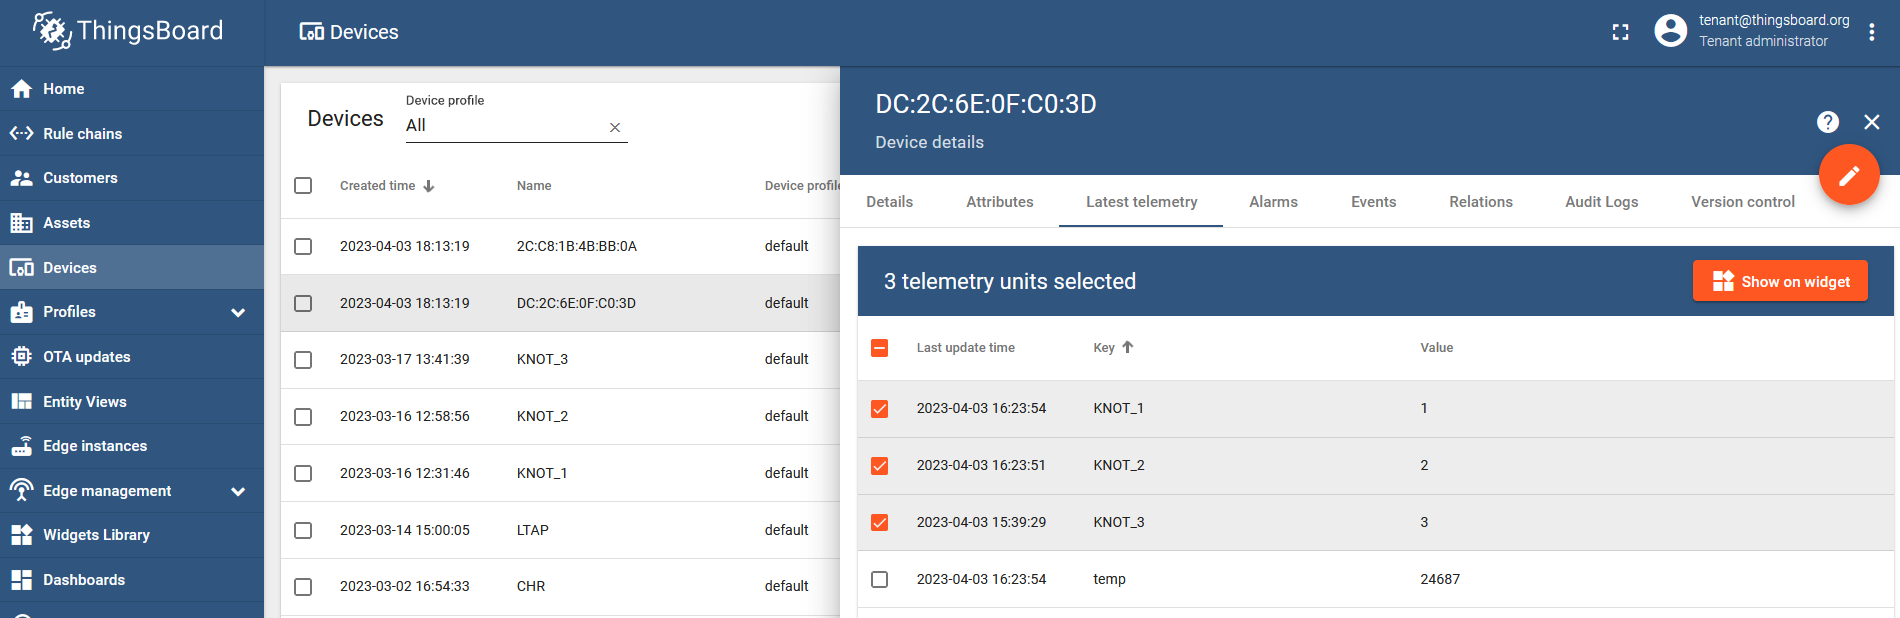
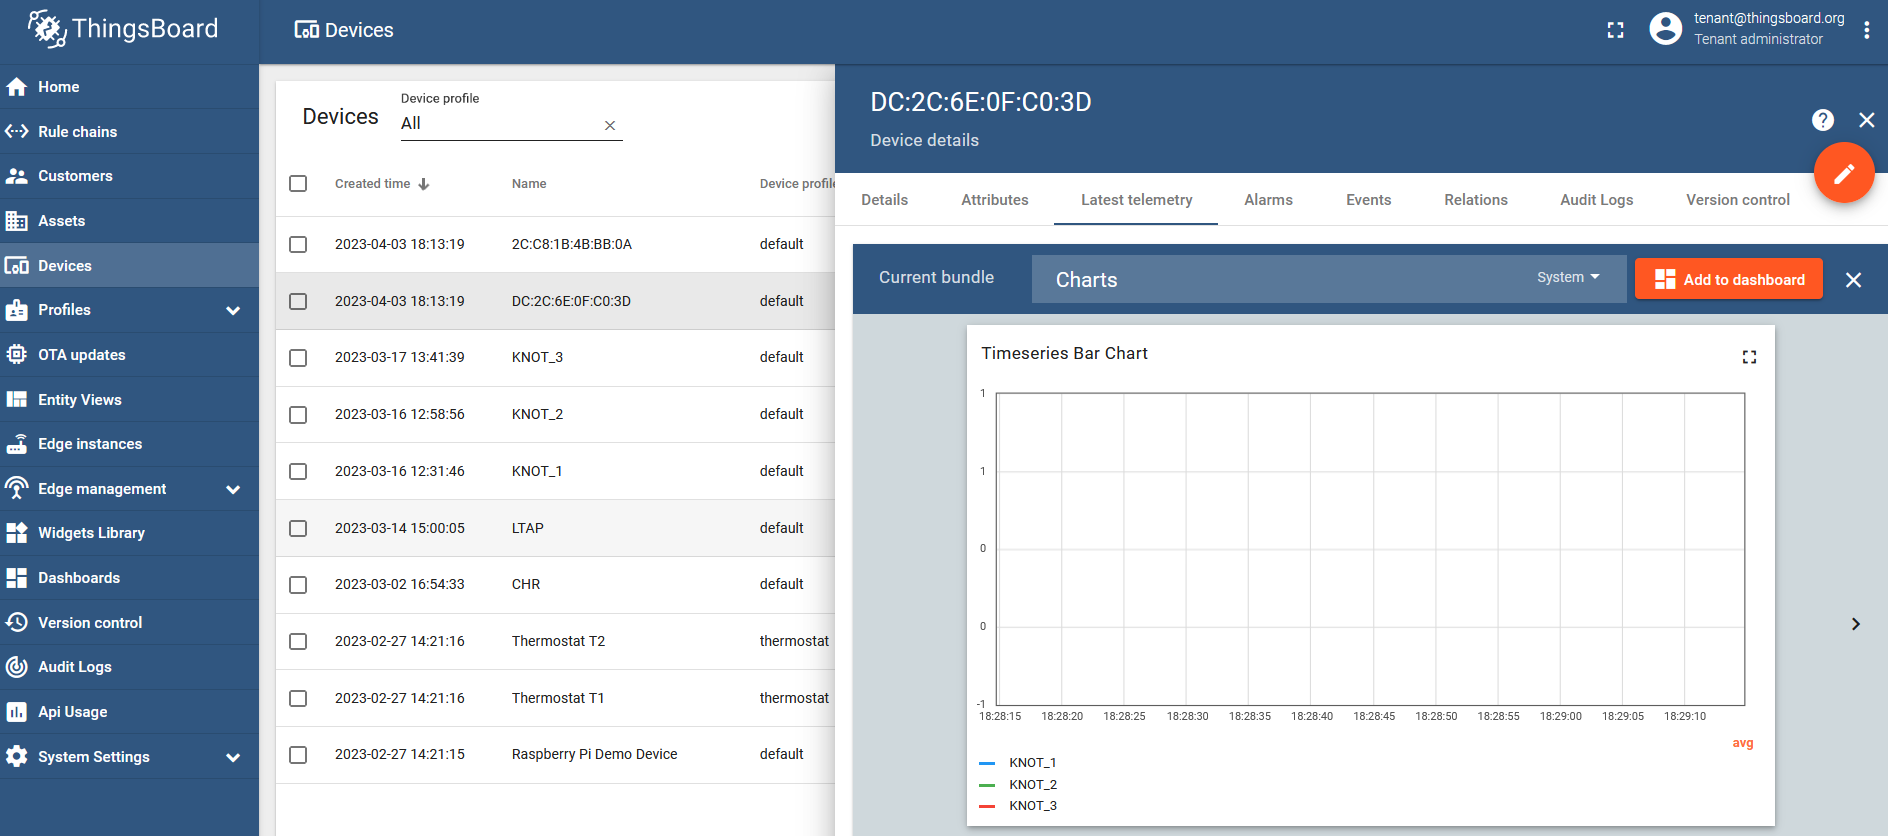
Select the tag's MAC address from the list of devices, go to the "Latest telemetry" section, checkbox KNOT IDs that you wish to monitor, and click on the "Show on widget" button:
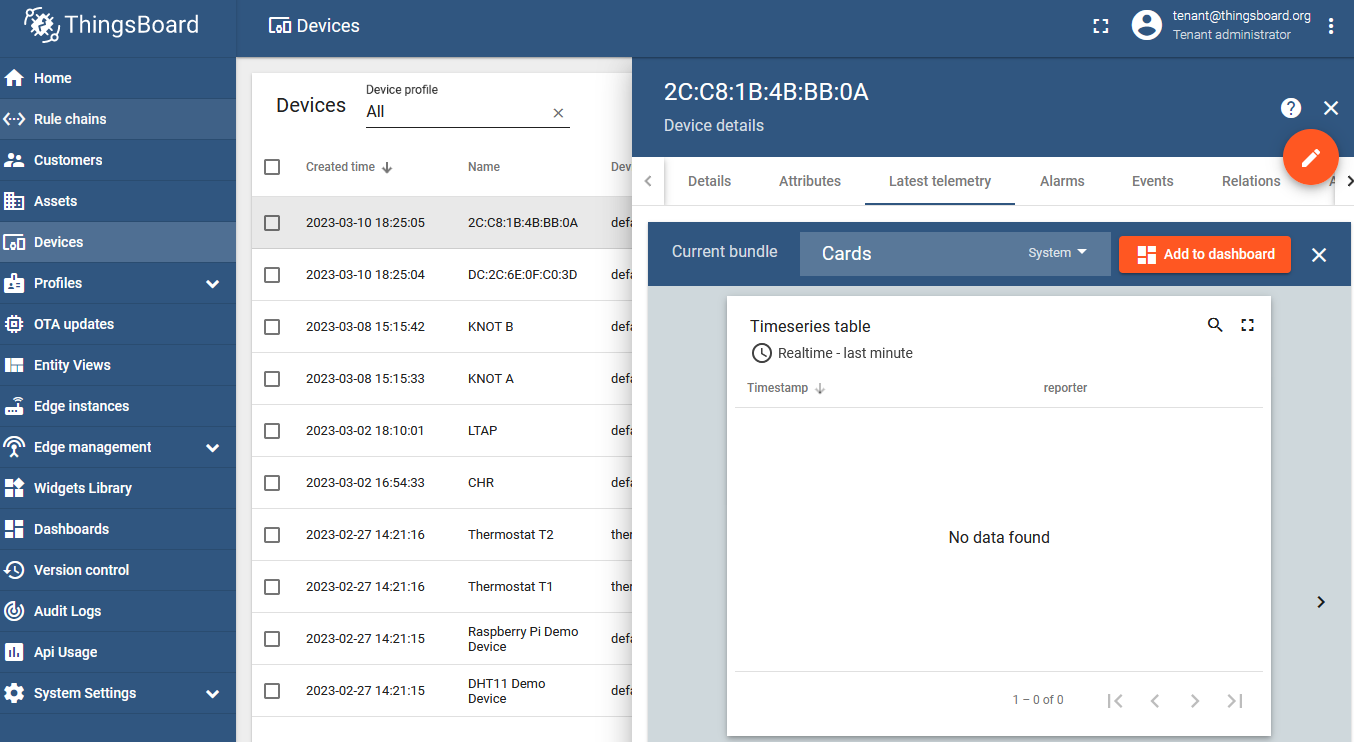
Select a widget that you wish to use, for example under the "CardsCharts" bundle, "Timeseries tableBar Chart" and click on "Add to dashboard":
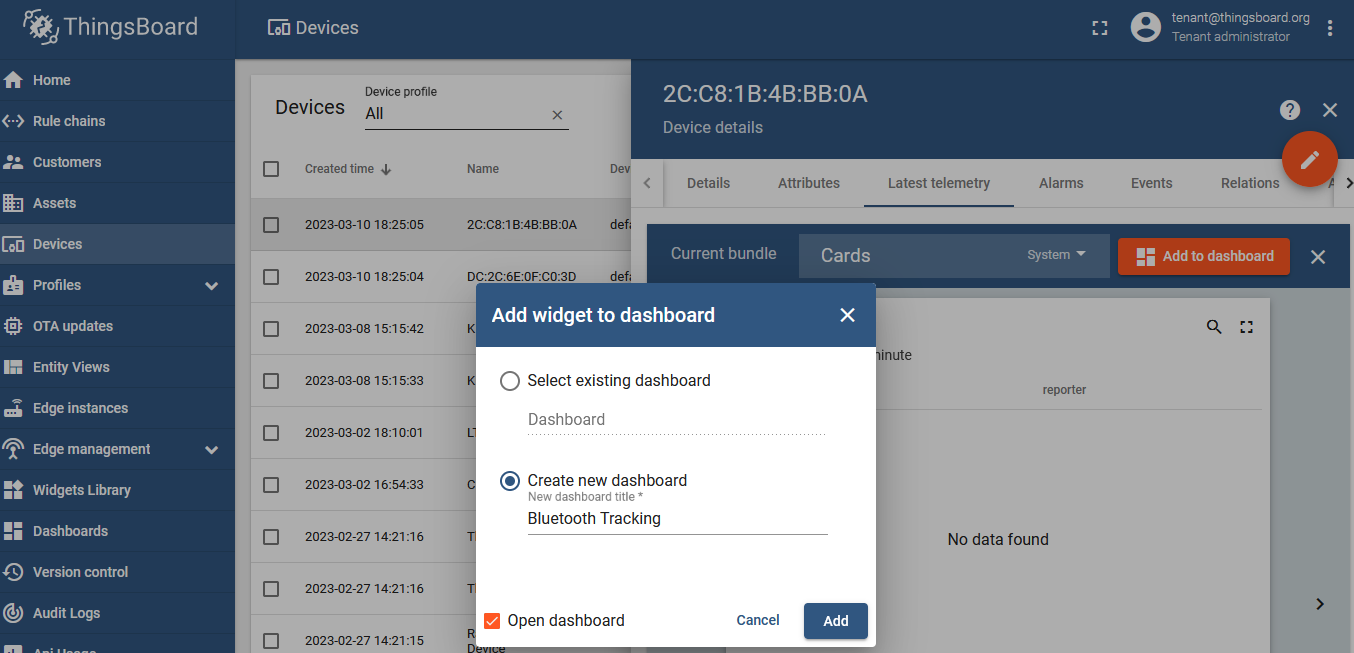
Create a new dashboard and name it, however, you like. Click on "Add":
Do the same steps for your other tags that appeared under the "Devices" tab. Create a new widget for each unique tag under the same dashboard.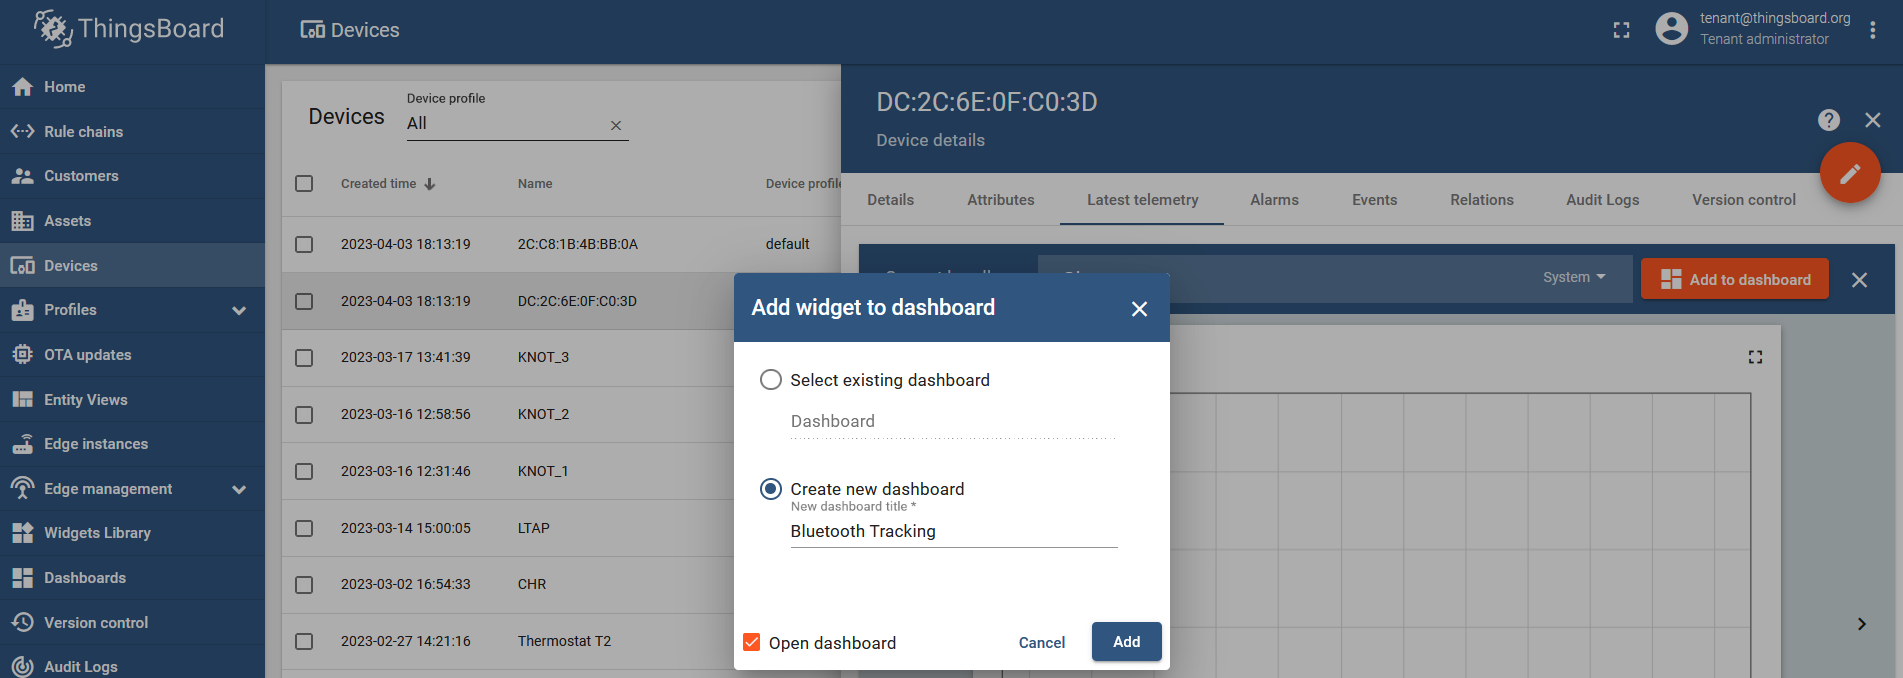
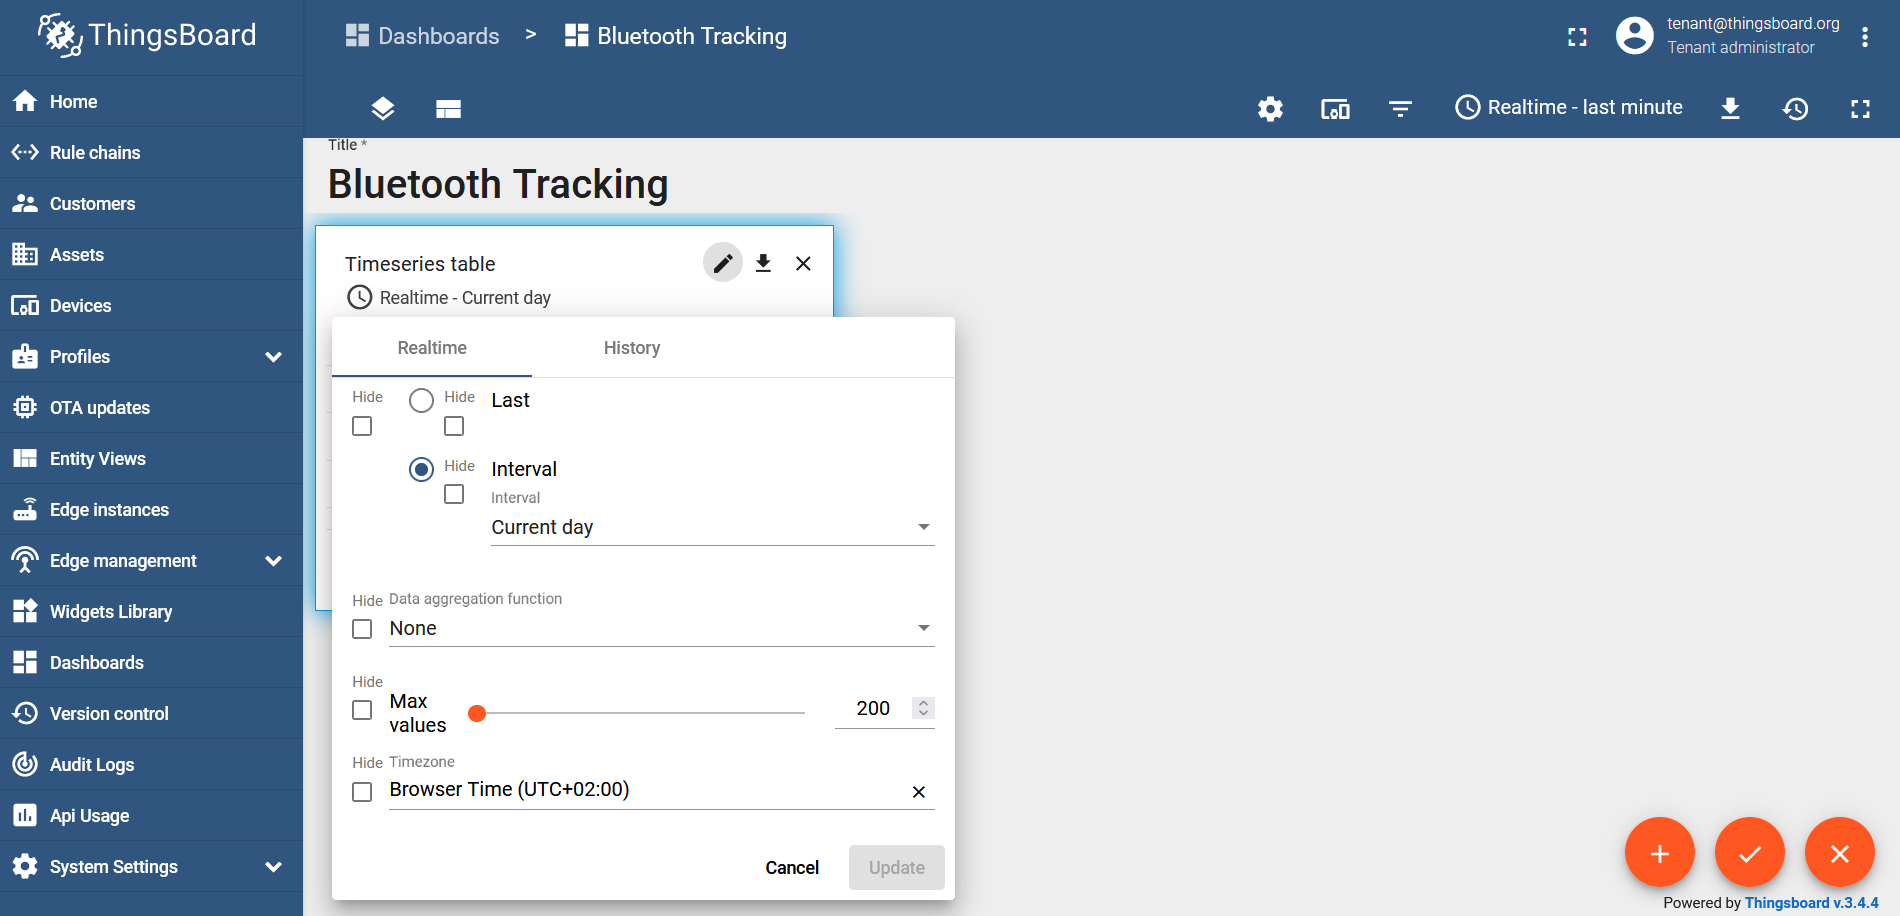
Change the widget's "Timewindow" from "Realtime-last minute" (which is used by default) to "Realtime-current day":
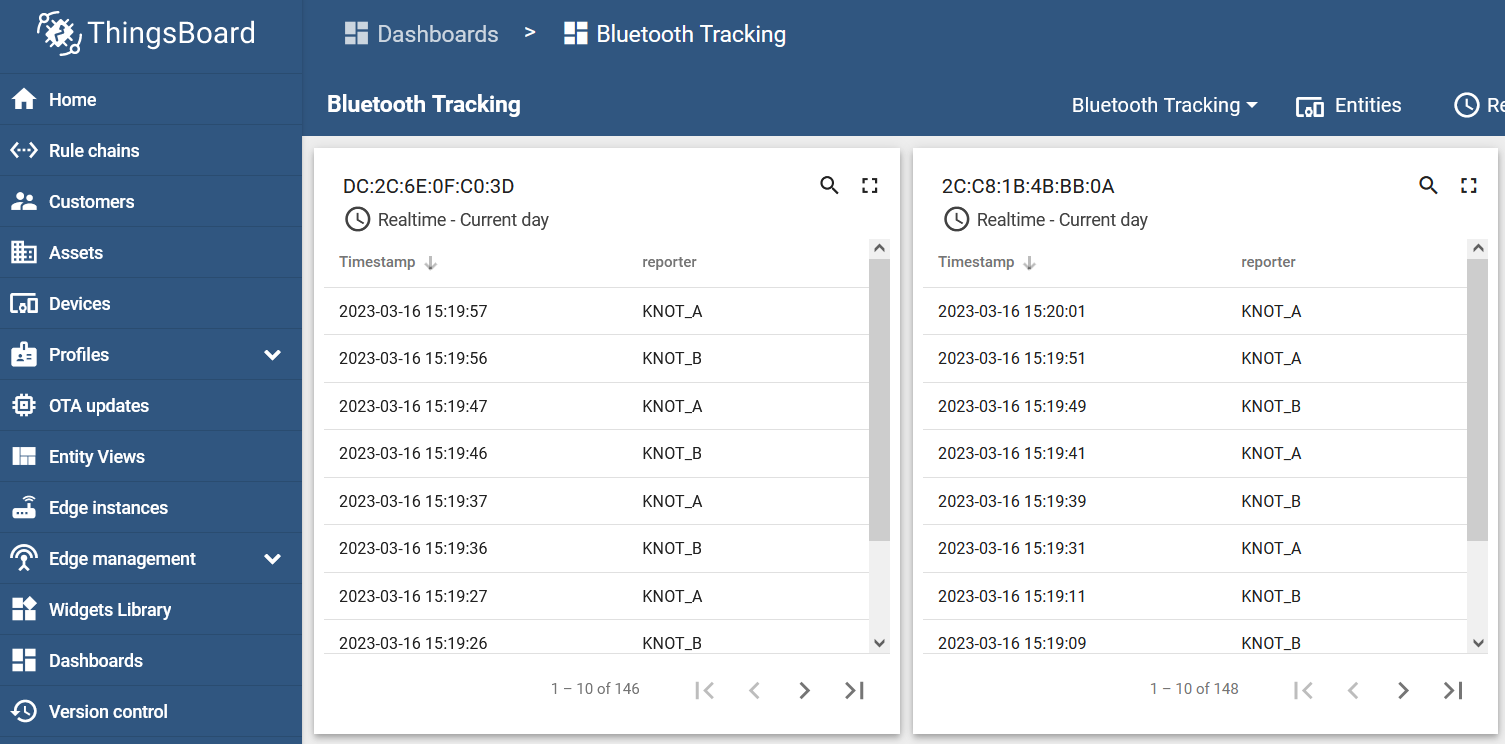
As a result, if both tags are inside the KNOT A range, the dashboard would show:

If they move to the KNOT B range, it would show:

If the tags move to the overlapped area, inside both ranges, both reporters (KNOT_A and KNOT_B) should show up within a few seconds after each other, depending on the interval used in the scheduler:
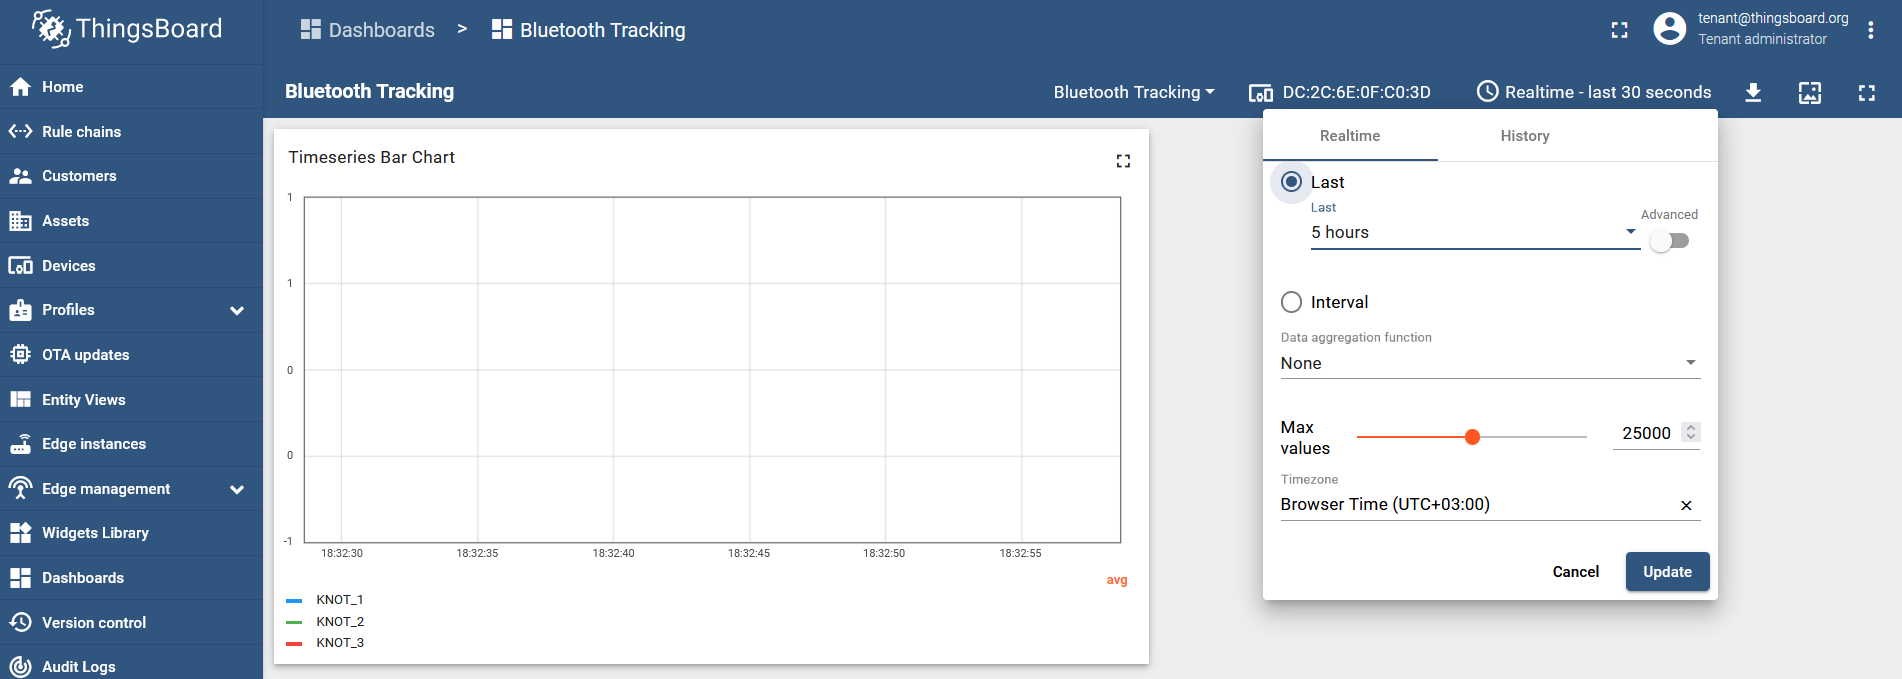
last 5 hours" and disable "data aggregation function" (select "none"):
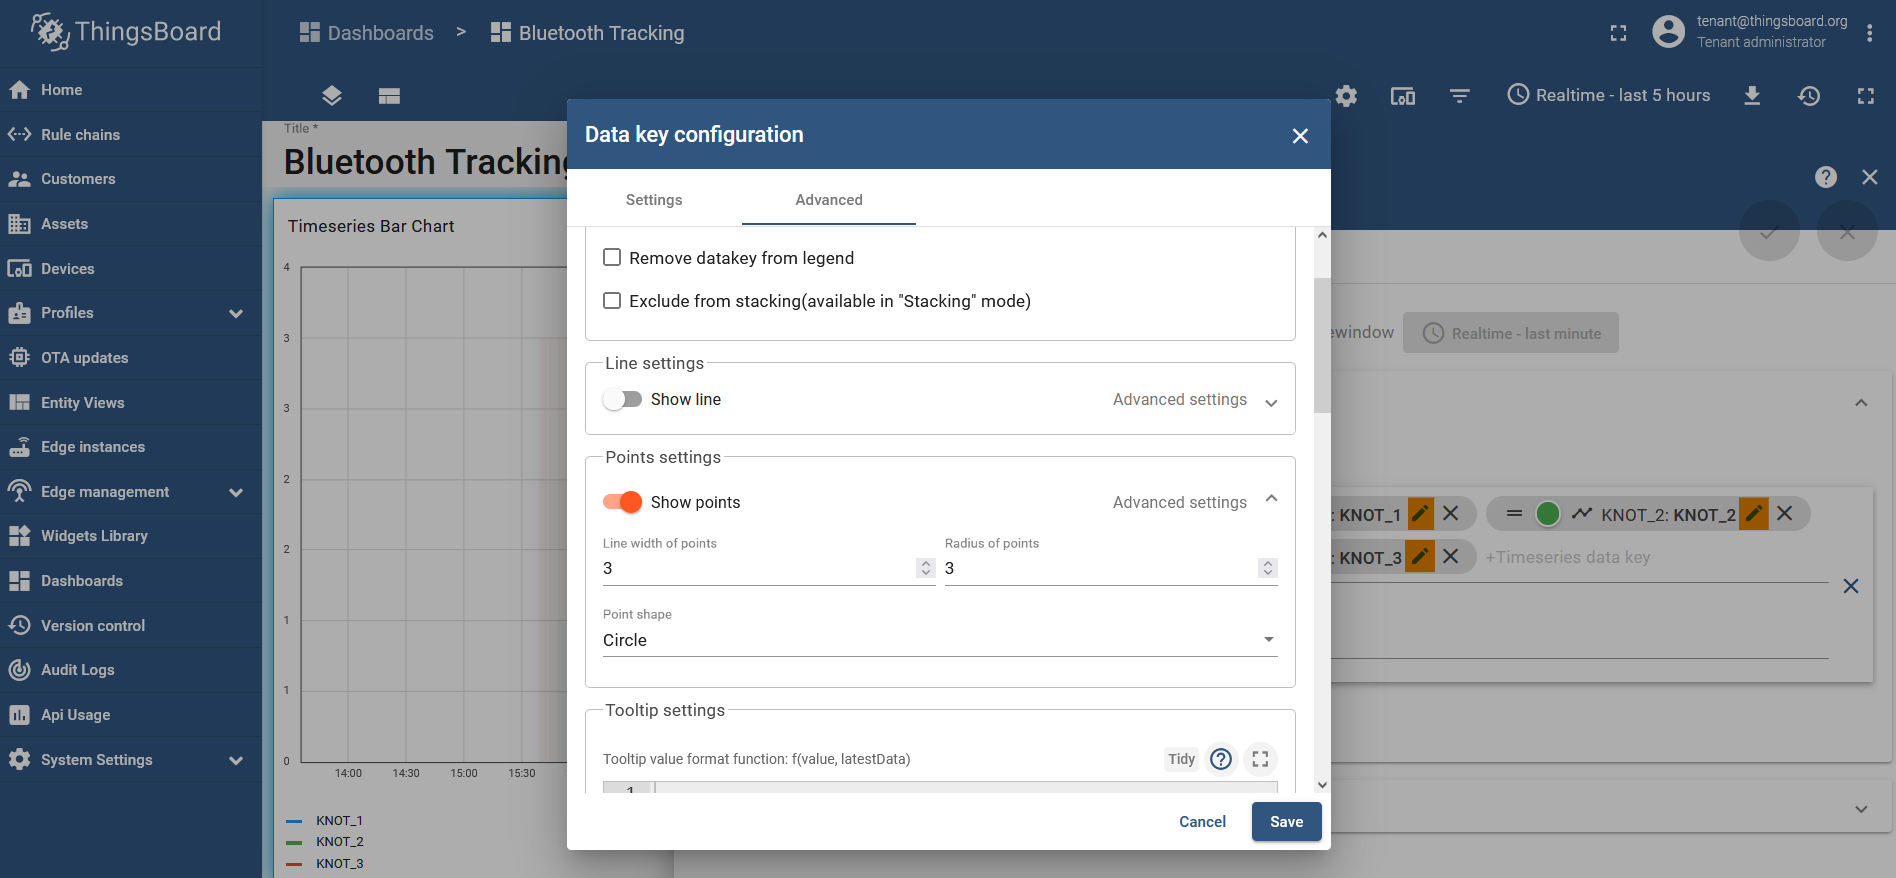
Edit the widget and then edit each KNOT_X parameter to add the "Show points" checkbox, so you can easier verify the results:
The result would look like this: